BatchGeo
BatchGeo: Building & Scaling a Production Mapping Platform
Long-term development, infrastructure, and platform partnership for one of the web's leading tools for creating interactive maps from data.
Long-term development, infrastructure, and platform partnership for one of the web's leading tools for creating interactive maps from data.

BatchGeo
JS, Node.js, UX, SEO, GIS
Long-term development, infrastructure, and platform partnership for one of the web's leading tools for creating interactive maps from data.
BatchGeo lets anyone create an interactive map from a spreadsheet. Paste in a CSV, and within seconds you have a shareable, embeddable Google Map. It sounds simple. The engineering underneath it isn't.
The platform processes user-submitted data of wildly inconsistent quality: misformatted addresses, ambiguous location strings, inconsistent coordinate precision, and datasets ranging from a dozen rows to tens of thousands. It geocodes that data, normalizes it, and renders it into performant interactive maps, reliably, for a global user base, without making the complexity visible to the person on the other side of the screen.
SLIDEFACTORY has served as BatchGeo's ongoing technical partner since 2021, working across web development, cloud infrastructure, UX, and platform operations. Over four years, that partnership has produced more than a thousand feature additions and enhancements, two hundred bug resolutions, and multiple rounds of infrastructure modernization — all while keeping a live, widely-used platform stable and growing.
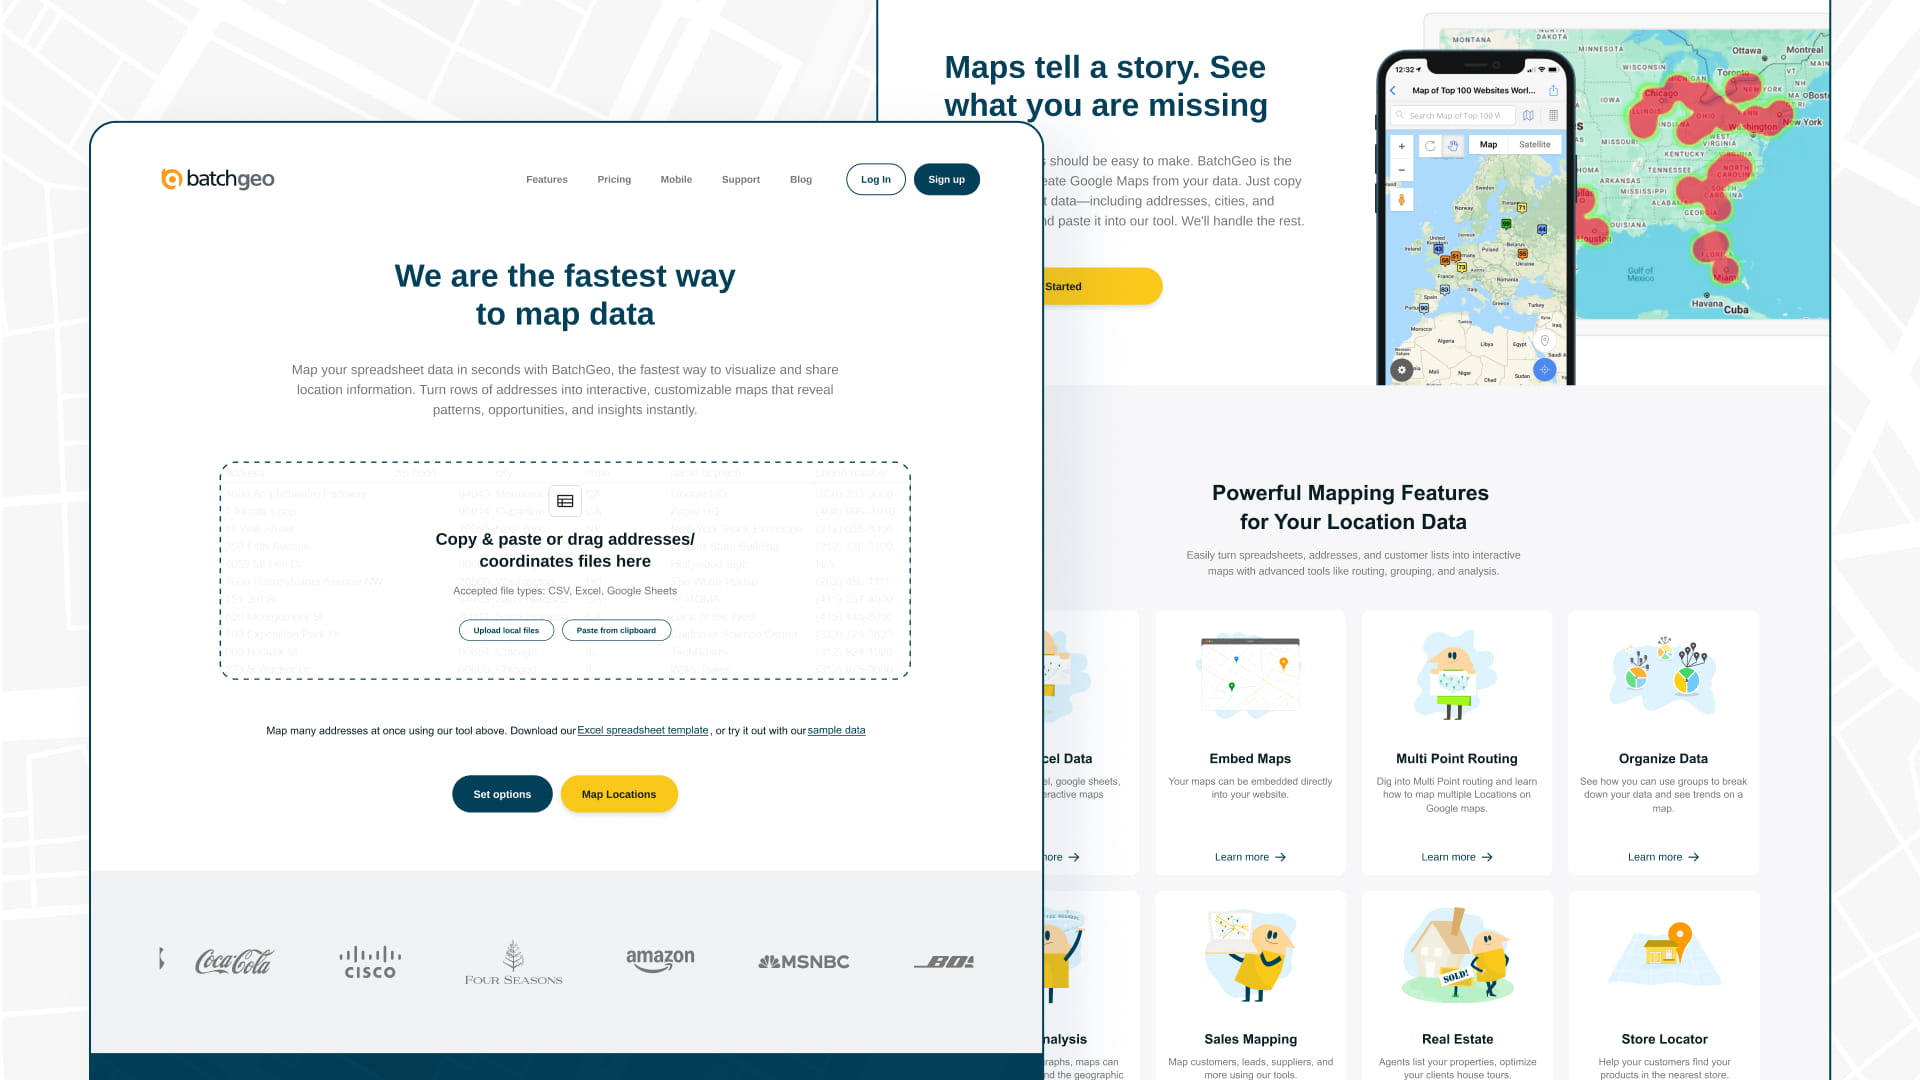
The central challenge of BatchGeo's platform is data ingestion. Users don't submit clean, structured coordinates. They submit spreadsheets. Phone lists. Business directories. Event rosters. Address columns formatted a hundred different ways.
SLIDEFACTORY owns and maintains the pipelines that take that raw input and produce map-ready output: validation logic that catches malformed data before it fails downstream, normalization routines that standardize inconsistent formatting, and the geocoding layer that converts addresses and place names into the latitude and longitude coordinates the mapping layer needs. Getting this right, quickly and reliably, for every dataset a user might submit, is what makes BatchGeo's core promise work.
A significant part of that work involved diagnosing and resolving failures in the background job system responsible for map generation. Queue reliability issues were causing inconsistent processing and silent failures under load. We identified the failure points, stabilized the job system, and reduced pipeline errors across the board, resulting in more consistent map generation and a meaningfully more stable platform overall.
As BatchGeo's user base grew, so did the complexity of what users needed to visualize. Point mapping on a Google Maps base layer is the foundation, but production mapping at scale requires more. This phase of work expanded the platform's spatial capabilities significantly, and it has continued expanding them ever since.
We implemented deck.gl, a high-performance WebGL-based rendering framework, to handle large datasets and support more complex visual layers than the base map integration could provide on its own. Designed to enable smooth rendering of thousands of data points without degrading the map interaction experience, this work expanded the platform's capacity for high-volume visualization.
We also implemented boundary maps and choropleth mapping, extending the platform beyond point-based visualization into region-level spatial representation. Users can visualize location data as polygons, territory overlays, and shaded regional maps, mapping results by state, county, region, or other defined boundaries. This moves BatchGeo from answering "where are these points" to "what does this region look like" — a meaningful expansion in what the platform can communicate visually.
Heatmaps add another dimension, allowing users to visualize data density and geographic concentration patterns across large datasets. For users analyzing foot traffic, sales distribution, or any location data with meaningful clustering, heatmap rendering surfaces patterns that point maps obscure.
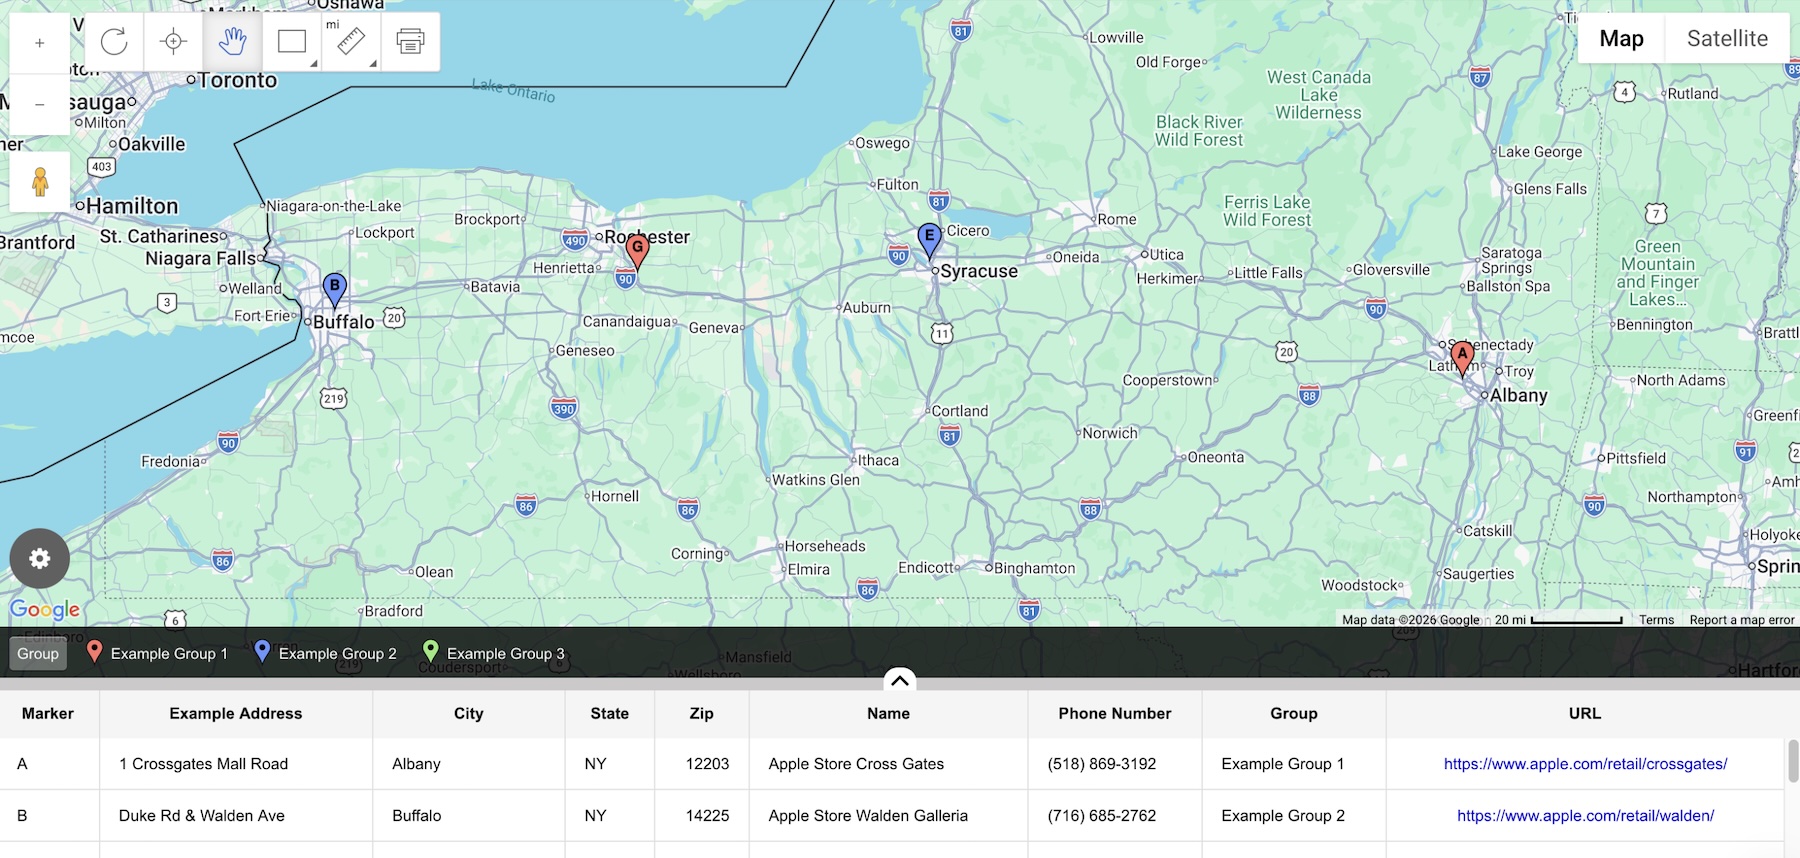
For dense datasets where many points share the same or nearby coordinates, we built SpiderFire, a custom marker spiderfying system. Rather than stacking markers on top of each other and making underlying data inaccessible, SpiderFire collapses nearby points into a single grouped marker, then expands into a radial layout on hover or interaction. Every underlying data point remains accessible. It's the kind of feature that looks effortless to the user and requires careful engineering to get right.
Beyond core mapping, we also built out BatchGeo's store locator mode, enabling businesses to deploy BatchGeo as a customer-facing location finder — a distinct product use case that required its own UX patterns and data handling logic.
With expanded mapping capabilities came expanded infrastructure demands. SLIDEFACTORY led a major migration and architectural overhaul within AWS, reworking the system to better support high-volume data processing and reducing bottlenecks in map generation and data handling.
Geographic data processing is bursty by nature. A single user can submit a dataset that puts real pressure on the pipeline. The architecture we built absorbs those spikes without degrading map rendering performance or impacting other users. Uptime and load time stability are baseline expectations for a platform this widely used, and the infrastructure work ensures BatchGeo meets them consistently.
We also implemented advanced caching strategies using Cloudflare, improving load times and global delivery performance while reducing server strain and strengthening the platform's security posture. For a platform with users distributed across North America, Europe, and growing markets in Asia, edge delivery performance directly affects the map experience.
There's a consistent gap in tools that deal with geographic data: they're built for people who already understand GIS, geocoding, or spatial data, not for the majority of users who just want to plot their data on a map. BatchGeo's value is that it closes that gap. SLIDEFACTORY's UX work keeps it closed.
Through ongoing design updates across four years, we've refined BatchGeo's interface to make the data-to-map workflow as direct as possible, from the CSV upload experience through map customization and sharing. This includes a full legend system overhaul, color theme selection, marker grouping and layering controls, DMS coordinate handling, and full-screen data views. Features like SpiderFire and choropleth maps add real capability, but only if users can discover and use them without friction. Keeping the interface intuitive as the platform grows in complexity is an ongoing design challenge, and one we work on continuously.


Supporting that user experience is a content platform built to match it. SLIDEFACTORY redesigned and rebuilt BatchGeo's blog from the ground up, including all page templates and the overall content experience. The rebuilt platform integrates directly with BatchGeo's main product, keeping editorial content and the core mapping tool connected within a unified user experience. The result is a faster, more maintainable content platform that supports BatchGeo's growing library of mapping guides, tutorials, and data visualization resources — content that now drives a significant share of the platform's organic search traffic.
BatchGeo operates as a subscription platform, which means payment reliability is directly tied to business continuity. SLIDEFACTORY integrated Braintree with 3D Secure (3DS) for fraud prevention and compliance with evolving international payment standards, ensuring strong customer authentication without introducing friction into the upgrade flow. As regulatory requirements around payment processing have continued to evolve, we've kept BatchGeo's billing infrastructure current and compliant.
The cumulative effect of this work shows clearly in BatchGeo's platform performance. Over the past year, the platform recorded 427K clicks and 34.3M impressions in organic search, representing a 137% increase in clicks and a 211% increase in impressions from the prior baseline period. Average ranking position improved from 24.7 to 16.3 year-over-year, moving BatchGeo toward consistent first-page visibility for high-value queries including map plotter, create map from Excel, CSV map generator, and distance calculator map.
Engagement metrics reflect strong product intent alignment: a 66.8% engagement rate and 95.9 second average session time across 1.02M organic sessions annually. Users on map creation and editing pages — the core product workflow we've invested in heavily across four years — average the longest session times on the platform. The rebuilt blog contributes meaningfully to that traffic, drawing steady long-tail visitors through tutorial and educational content.
The platform's backlink profile extends that reach further: 1.4M backlinks from 26.3K referring domains, with an Authority Score of 42, driven in part by the widespread embedding of BatchGeo maps on third-party sites across the web.
BatchGeo isn't a project we delivered and handed off. It's a platform we help run — and have been running since 2021.
Long-term platform partnerships require more than feature development. Maintaining engineering velocity across a codebase this size means investing continuously in the systems that support it: the deployment pipeline, the development environment, the internal architecture that determines how quickly new capabilities can be built and shipped. A significant part of our recent work has been exactly that — modernizing core systems to keep BatchGeo's development pace fast and its foundation solid.
That kind of work — unglamorous, technically demanding, and essential — is what a real technical partnership looks like. For a mapping platform used by millions of people to visualize geographic data every year, that depth of ownership matters.


Want to make something incredible? We'd love to hear from you.